


A profitable forecast can still hide a cash squeeze that threatens a deal. Financial simulation for deal readiness tests whether cash flow, working capital, debt, and liquidity can withstand the demands of a potential transaction. Deal readiness means preparing a business’s financial and operational information for evaluation in a merger, acquisition, investment, divestiture, financing transaction, or partnership.
Sound reporting and reliable forecasts matter because buyers and investors assess more than headline profitability. They examine how revenue is recognized, whether tax reporting is accurate, how debt affects liquidity, and whether projected results are supported by consistent records. This article explains how to model cash flow and working capital, stress-test financial assumptions, and identify reporting gaps before due diligence. It also covers the tools that can structure scenario analysis and shows how forecast, profitability, and liquidity findings fit into a more complete view of transaction readiness.
Key Takeaways
- Link income statement assumptions to balance sheet movements and cash flow to expose working-capital pressure before it constrains a transaction.
- Stress-test debt obligations against liquidity scenarios to see how changes in collections, payments, or operating performance affect cash availability.
- Strengthen forecasts by documenting assumptions, aligning management reporting, and comparing projected results with historical performance.
- Review revenue recognition and profitability by testing whether reported earnings reflect consistent accounting treatment and sustainable operating performance.
- Model acquisition scenarios with changing assumptions for revenue, costs, financing, and integration to identify which variables most affect deal outcomes.
Cash flow forecasting and working capital
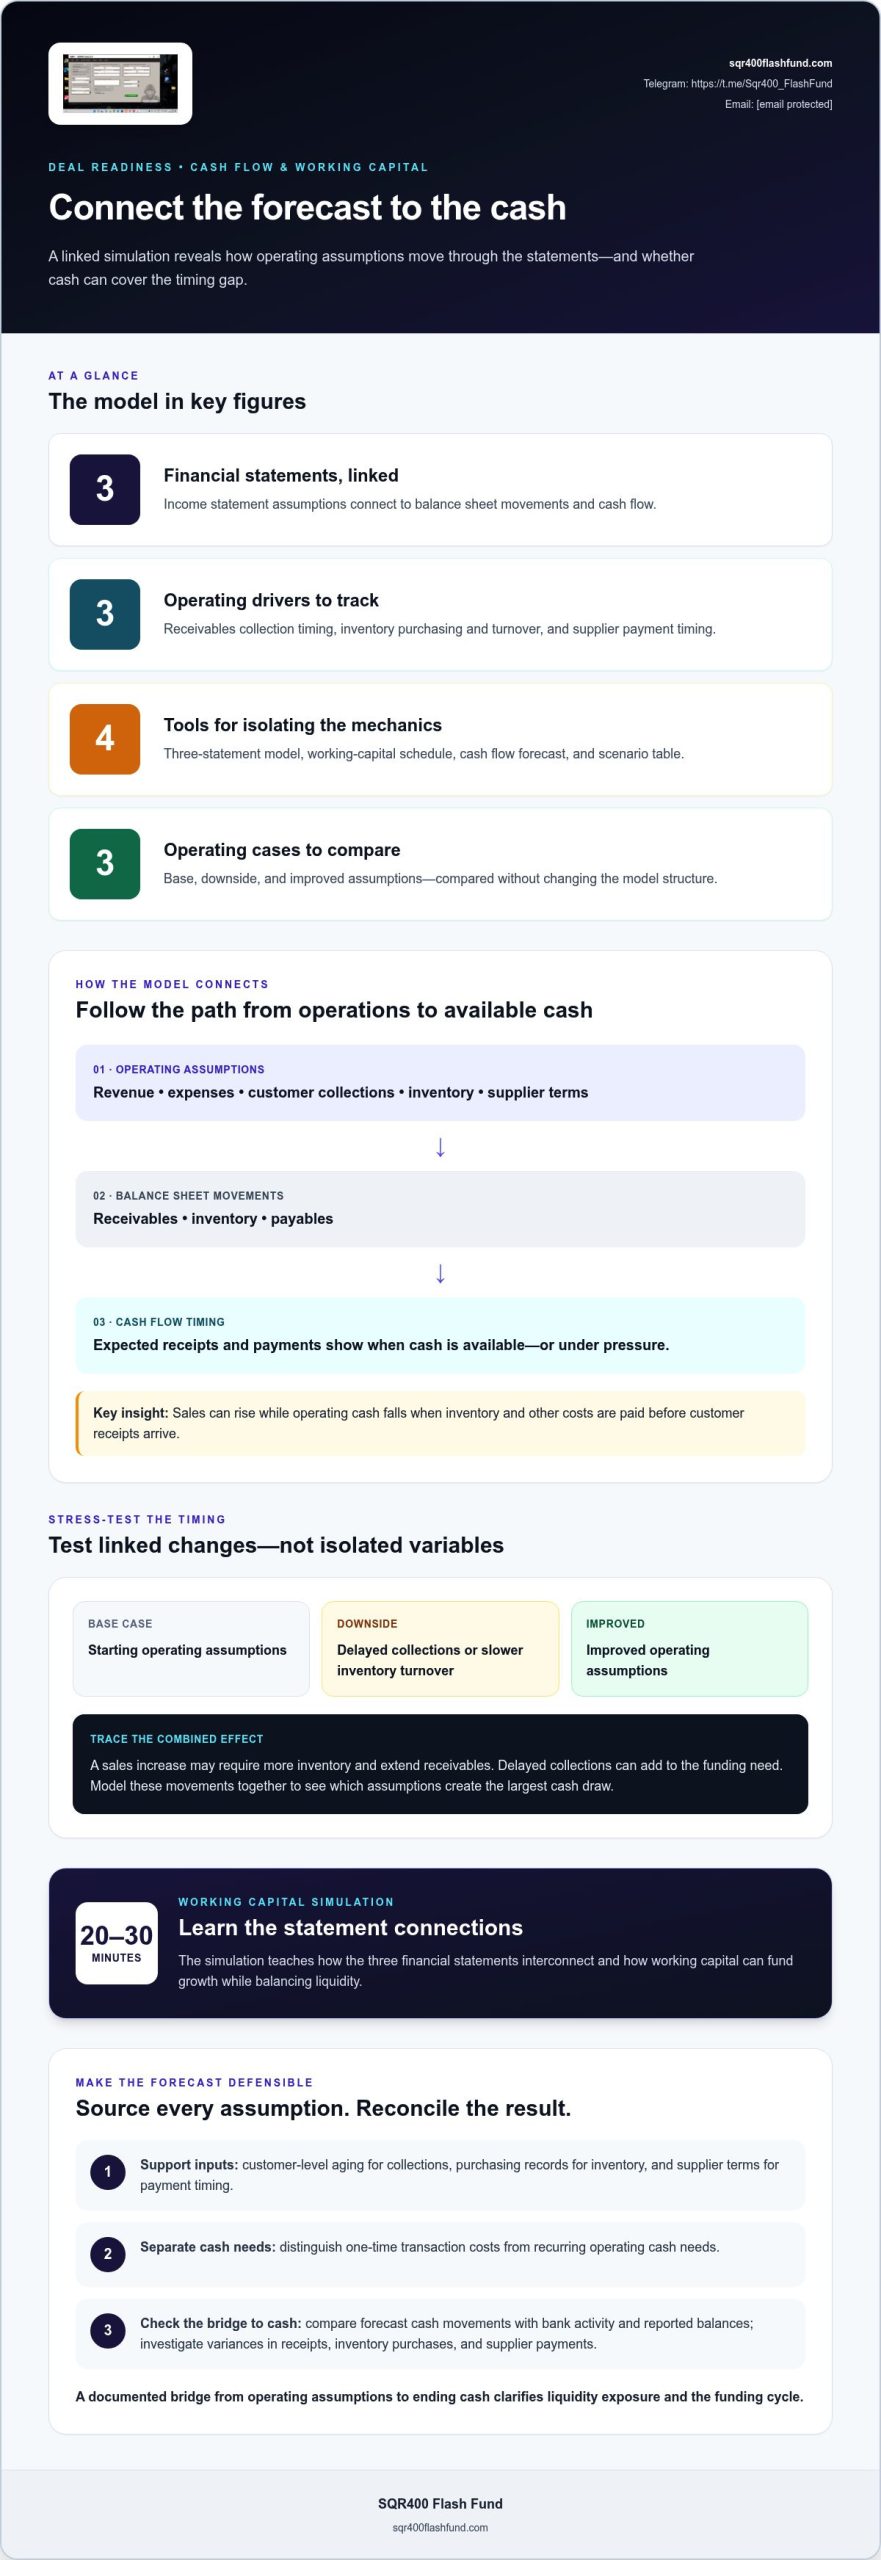
Start with a linked forecast, not an isolated profit estimate. The income statement records revenue and expenses, while the balance sheet tracks receivables, inventory, and payables. The cash flow statement shows how those movements affect available cash. A working-capital simulation connects all three statements and tests how growth consumes or releases internal funding.
Build schedules from operating drivers. For receivables, estimate collection timing from actual customer payment patterns. For inventory, model purchasing and turnover by product or business unit. For payables, map supplier terms and expected payment timing. These schedules show why reported sales can rise even as operating cash falls.
For example, a manufacturer may book a large order before receiving payment. Production increases inventory purchases, while wages and supplier invoices come due earlier. The model should show this timing gap and test whether available cash covers it. Compare the base case with scenarios for delayed collections or slower inventory turnover.
Use these tools to isolate the mechanics:
- Three-statement model: Links income statement assumptions to balance sheet balances and cash movements.
- Working-capital schedule: Tracks receivables, inventory, and payables as operating funding requirements.
- Cash flow forecast: Maps expected receipts and payments to reveal periods of liquidity pressure.
- Scenario table: Compares base, downside, and improved operating assumptions without changing the model structure.
Make every assumption traceable to a source. Tie collection estimates to customer-level aging, inventory inputs to purchasing records, and payment timing to supplier terms. Separate one-time transaction costs from recurring operating cash needs. This makes the forecast easier to explain during buyer diligence.
Test linked changes rather than isolated variables. A sales increase may require more inventory and extend receivables, while delayed collections can add to the funding need. Model these movements together, then identify which assumptions create the largest cash draw. This reveals whether growth is self-funding or requires working capital support.
The Working Capital Simulation teaches how the three financial statements interconnect and how working capital can fund growth while balancing liquidity. It takes 20-30 minutes. Use it to understand the mechanics, then apply the same logic to company-specific records and forecast assumptions.
Finish with a reconciliation. Compare forecast cash movements with bank activity and reported balances. Investigate variances in customer receipts, inventory purchases, and supplier payments. A documented bridge from operating assumptions to ending cash gives transaction partners a clearer view of liquidity exposure and the funding cycle.
Debt, liquidity, and tax reporting
Start debt analysis with a complete borrowing schedule. Record each facility’s balance, interest terms, repayment dates, maturity, and applicable covenants. Reconcile these details to the general ledger and lender statements. A mismatch between recorded debt and contractual obligations can distort projected cash availability and transaction analysis.
Next, model debt service against operating cash flow. Separate principal repayments from interest expense because they affect cash and reported earnings differently. In a downside case, reduce expected collections or operating performance, then test whether scheduled payments remain supportable. Track covenant headroom where loan agreements set performance thresholds.
Liquidity requires more than an ending cash balance. Map receipts and payments across the forecast period, including debt service, payroll, supplier invoices, and taxes. A business can report positive earnings yet face a payment shortfall if receipts arrive after obligations are due. Flag the timing and cause of each projected cash pressure.
Use distinct scenarios to examine the exposure:
- Debt schedule: Reconciles balances, repayments, interest, maturities, and covenant terms.
- Liquidity forecast: Shows whether expected cash receipts cover operating payments and debt service.
- Debt-service sensitivity: Tests how weaker cash generation affects repayment capacity and covenant headroom.
- Tax reconciliation: Bridges tax records to reported financial statements and identifies unexplained differences.
- Variance analysis: Compares actual results with forecasts and isolates drivers behind deviations.
Tax reporting needs a clear audit trail. Reconcile filed returns, tax-account balances, supporting schedules, and financial statements. Investigate differences by period and account, then document whether each variance reflects timing, classification, or an adjustment. Buyers and investors commonly review tax reporting accuracy alongside debt, liquidity, profitability trends, audit findings, and forecast reliability.
For example, tax expense recorded in the income statement may not match cash taxes paid during the same reporting period. Identify the balance-sheet account holding the difference and trace its movement. Keep supporting calculations and source records organized so reviewers can follow each adjustment without relying on verbal explanations.
Close the analysis with a controlled review. Tie debt balances to lender evidence, compare forecast payments with contractual schedules, and reconcile tax balances to source records. Assign an owner to each unresolved variance and record its effect on liquidity or earnings. Strong reporting controls and organized management reports can support a smoother due-diligence process.
Financial forecasting
A transaction forecast turns management expectations into explicit operating assumptions. Start with historical results, then identify the drivers behind revenue, expenses, investment, and funding. Make each assumption traceable to evidence such as signed contracts, sales pipelines, hiring plans, or supplier terms. A driver-based forecast is easier to challenge than one built on unexplained growth rates.
Break the model into business lines, customer groups, or product categories when the records support that detail. For example, a subscription business can forecast renewals, new customer additions, and cancellations separately. A manufacturer can connect output expectations to production capacity and input costs. These distinctions show which assumptions drive projected performance and where evidence is limited.
Use complementary tools for different forecasting questions:
- Driver-based forecast: Connects operational inputs, such as customer volume or production, to financial results.
- Budget-to-actual analysis: Compares approved plans with recorded results and identifies recurring variances.
- Scenario model: Shows how alternative assumptions change projected earnings, funding needs, and cash generation.
- DCF model: Translates projected cash flows into a valuation analysis using documented assumptions.
- APV analysis: Separates operating value from financing effects when assessing capital structure.
- Market-multiples analysis: Provides a comparative valuation lens using relevant market benchmarks.
Build a base case from the operating plan, then create downside and upside cases by changing defined drivers, not final outputs. A downside case might reflect weaker customer renewals and slower sales conversion. An upside case might assume stronger demand, constrained by available capacity. Record the rationale for each change so reviewers can distinguish evidence from judgment.
Test the forecast against historical performance. Compare prior projections with actual results, then identify recurring misses by business line or assumption. If planned sales repeatedly exceed converted orders, revise the pipeline conversion logic. If hiring starts later than planned, shift related payroll costs and expected capacity gains together. This creates an auditable link between forecast inputs and outputs.
Forecasting and budgeting are core deal-readiness controls. Present assumptions consistently across the operating plan, management reports, and valuation model. DCF, APV, and market-multiples analysis answer different valuation questions; none replaces a credible operating forecast. Together, they help decision-makers assess how forecast reliability, financing choices, and potential synergies influence transaction structure and negotiation.
Clear forecasting and budgeting processes support deal readiness by making assumptions available for review alongside operating plans. Strengthen these processes by documenting projected performance and the evidence behind each assumption. This connects business planning with transaction discussions without treating any single valuation method as sufficient.
M&A in Wine Country applies DCF, APV, and market multiples to deal structuring and negotiation, alongside forecasting and synergy analysis. These tools place projected cash flows, financing effects, and market comparisons in the broader deal context. Forecasting and synergy analysis also inform how a transaction is structured and negotiated.
Revenue recognition and profitability
Revenue recognition determines when reported sales enter the income statement. Buyers examine the underlying contracts, invoices, delivery records, and accounting entries. A transaction simulation should trace selected revenue from customer agreement through recording and collection. This sequence can expose timing differences, unsupported entries, and inconsistent treatment across business units.
Start with a revenue-to-ledger reconciliation. Select representative contracts and compare their commercial terms with invoices and recorded revenue. For a service contract spanning reporting periods, inspect how the business records work performed over time. For a product sale, compare the entry with delivery evidence and the company’s stated accounting policy. Document exceptions and their financial effect.
Test revenue assumptions against business activity. Compare customer-level sales data with invoices, credit notes, renewals, and cancellations. A large invoice near period-end needs a clear transaction trail. Review whether later credits or cancellations change the interpretation of reported performance. Separate recurring revenue from one-time sales so projections don’t treat a temporary event as a lasting trend.
Profitability analysis should explain both margins and earnings quality. Reconcile gross profit to product or service costs, then assess operating expenses by function. Higher forecast sales may not improve profit if discounts, fulfillment costs, or staffing rise faster. Compare customer groups and product lines to see whether growth is concentrated in lower-margin activity.
- Contract-to-ledger sample: Traces commercial terms to invoices, accounting entries, and supporting evidence.
- Revenue bridge: Separates new sales, renewals, cancellations, credits, and other movements between reporting periods.
- Margin analysis: Compares revenue with direct costs across products, services, or customer groups.
- Profitability variance analysis: Explains differences between reported results, budgets, and forecasts.
- Cutoff review: Examines transactions near a reporting-period boundary for consistent recording and documentation.
Use a variance schedule to explain changes in revenue and profit. For example, revenue may rise while gross margin falls because the sales mix changed. Where records allow, separate the effects of volume, pricing, discounts, and direct costs. This gives reviewers a more precise explanation than a single consolidated margin percentage.
Then model how accounting and operating assumptions affect projected profitability. Keep revenue timing, customer retention, pricing, and direct costs distinct. Change one driver at a time before testing combined downside conditions. Financial simulation for deal readiness should link each scenario to contract evidence and historical results, not simply extend the latest reported trend.
Finish with an evidence pack linking each material revenue category to policies, contracts, reconciliations, and management reports. Record open exceptions, assigned owners, and resolution status. Consistent reporting controls help potential buyers assess revenue recognition, profitability trends, and forecast reliability during diligence.
What deal scenarios and assumptions should an acquisition financial simulation test?
An acquisition model should test the combined business, not just add two standalone forecasts. Build a transaction case that reflects the purchase structure, funding approach, integration plan, and expected timing. Keep target and acquirer results visible separately before calculating combined performance. This preserves the source of each projected change and makes assumptions easier to challenge.
Model synergies as specific operating actions. For example, consolidating overlapping systems may change technology costs, while combining distribution may affect logistics expenses. Identify each action, its expected financial effect, the responsible function, and its timing. Separate cost savings from revenue opportunities because they depend on different operational evidence. Avoid counting the same benefit in multiple business units.
Test these acquisition-specific variables:
- Purchase structure: Compare how cash consideration, assumed debt, or other transaction terms affect the combined balance sheet.
- Financing mix: Model debt and equity inputs separately to show effects on interest expense, liquidity, and ownership.
- Integration timing: Align system, process, and workforce changes with the period when related costs or benefits begin.
- Synergy realization: Test delayed, partial, and planned delivery against named initiatives and accountable teams.
- Standalone downside: Stress the target and acquirer independently before combining results.
A sensitivity table helps isolate key assumptions. Change one variable, such as customer retention or integration timing, while holding other inputs constant. Then use a combined downside case to show how multiple pressures interact. This helps decision-makers distinguish the effect of one assumption from broader execution risk.
Use an integration tracker to connect modeled benefits with implementation milestones. For each initiative, record the operating owner, dependency, evidence, and affected financial line. A technology consolidation, for instance, may depend on migrating records before legacy systems can be retired. The model should reflect that sequence rather than recognize savings before the operational change.
Include transaction costs and one-time integration spending as separate model lines so temporary expenses do not obscure ongoing performance. Reconcile each assumption to diligence findings, management records, or a defined integration action. If a synergy lacks an owner or operational pathway, keep it out of the core case. This makes the acquisition analysis more transparent and gives reviewers a clear basis for testing the combined business.
If operational evidence is incomplete, treat a modeled benefit as uncertain rather than assuming it will arrive on schedule. Operational readiness can also inform scenario assumptions. Investors and acquirers commonly assess ERP capabilities, process standardization, data governance, supply chain visibility, workforce readiness, cybersecurity, and access controls. Consider whether gaps in these areas could affect the timing or delivery of modeled integration actions, and make the supporting evidence visible to reviewers.
Organized operational records and consistent governance structures can help businesses respond to strategic opportunities, financing discussions, and acquisition proposals. A manufacturing company preparing for acquisition may organize five years of audited financial statements before approaching buyers. In a simulation, these records help reviewers trace assumptions to available information, while readiness assessments flag dependencies that may alter execution. Tie any resulting changes to the relevant initiative and financial line so scenarios reflect documented readiness, not unsupported adjustments.
SQR400 Flash Fund: SQR400 v5.8 Pro
SQR400 Flash Fund lists SQR400 v5.8 Pro, but the available product information does not establish it as a tool for acquisition financial modeling. Deal analysis should rely on verifiable accounting records, documented forecast assumptions, and traceable scenario calculations. Use a controlled spreadsheet or established financial-planning system to model cash flow, debt, revenue, and integration assumptions. Preserve source data and calculation logic so reviewers can reproduce the results.
For transaction readiness, keep simulated outputs distinct from actual bank, tax, and accounting records. Do not present generated financial visuals as evidence of funds, transactions, or operating performance. Contact a qualified financial professional to assess modeling requirements, or consult SQR400 Flash Fund for information about its listed software.
Set the next transaction-readiness milestone
Turn the model into a controlled decision process. Assign an owner to each material assumption, define the evidence needed to validate it, and record changes in a version-controlled file. Keep forecast outputs separate from actual accounting records so stakeholders can distinguish scenarios from reported results.
Financial simulation for deal readiness is most useful when it informs a specific decision: whether to proceed, adjust transaction terms, or close an identified reporting gap. Set a review cadence around new diligence findings and update affected assumptions rather than rebuilding the entire model. This discipline preserves traceability as the transaction develops.
Before sharing results, confirm every material figure has a clear source, each scenario has an explicit rationale, and each open issue has an accountable owner. For information about available software, review the SQR400 Flash Fund website. You can also contact the team on Telegram or by email. A documented next step gives your team a clear basis for moving forward.
Frequently Asked Questions
What is Deal Readiness?
Deal readiness is the preparation that enables a company to present its financial, operational, and governance position clearly during a transaction. It applies to a sale, acquisition, investment, divestiture, financing, or partnership. For example, a seller should be able to explain how reported results connect to contracts, customer records, and management decisions. Readiness also means organizing materials so transaction partners can evaluate the business without relying on undocumented explanations.
Which financial metrics and documents should be included in a deal-readiness simulation?
Include revenue, gross margin, operating profitability, working-capital balances, debt, liquidity, and cash flow. Support the model with income statements, balance sheets, cash flow statements, trial balances, general-ledger detail, customer and supplier records, debt agreements, and tax returns. Add accounts-receivable aging and revenue by customer or product where available. These records help explain concentration, unusual movements, and the assumptions behind projected results.
What steps prepare a company’s financial data and forecasts for a potential sale or acquisition?
Start by reconciling accounting records to bank statements, subledgers, and filed tax records. Then standardize account mappings and management reports so periods and business units can be compared consistently. Document forecast assumptions with operating evidence, such as signed contracts or approved hiring plans. Finally, assign owners to unresolved differences and maintain a controlled file set for diligence. Buyers can then trace key forecast inputs back to source records.
Which accounting, tax, and regulatory rules affect deal-readiness financial modeling in the United States?
U.S. modeling must reflect the company’s applicable accounting framework, tax reporting obligations, entity structure, and transaction context. For example, a forecast should distinguish book income from taxable income and connect tax assumptions to filed returns and supporting schedules. State and local obligations may also affect the analysis. Transaction-specific regulatory requirements depend on the parties, industry, and deal structure, so model them as explicit assumptions supported by qualified review.